
Monitoring and alerts
Logs
pulsed writes JSON logs (Go slog) to stdout; read them with docker compose logs pulsed. Set the level with PULSE_LOG_LEVEL (debug, info, warn, error). Secrets, tokens, webhook URLs and seeds are never logged; errors from outbound HTTP calls have their URL stripped, because a webhook URL can itself be the secret.
Health and metrics
pulsed has a separate metrics listener, PULSE_METRICS_ADDR (default 127.0.0.1:9464), published on host loopback only:
| Path | Purpose |
|---|---|
/healthz | Liveness: the process is up |
/readyz | Readiness: 200 once pulsed is connected and serving, 503 before. The container health check (pulsed healthcheck) probes it |
/metrics | Prometheus metrics: pulsed, NATS (server and JetStream), streams, Go runtime and process |
/internal/v1/bans | The ban feed for banagent (bearer token) |
curl -fsS 127.0.0.1:9464/readyz
curl -s 127.0.0.1:9464/metrics | grep ^pulse_stream_bytes
The full list of metrics is in the metrics reference. Route labels carry only the first path segment, never names, IDs or subjects, so the label set stays small and leaks nothing.
Grafana Alloy
The reference deployment runs Grafana Alloy on the host network. It scrapes 127.0.0.1:9464 every 15 seconds and the host (CPU, memory, disk, network) every 30 seconds. The reference config has no remote_write: add your own endpoint to ship metrics somewhere. Pulse's own alerts do not depend on Alloy.
The System page
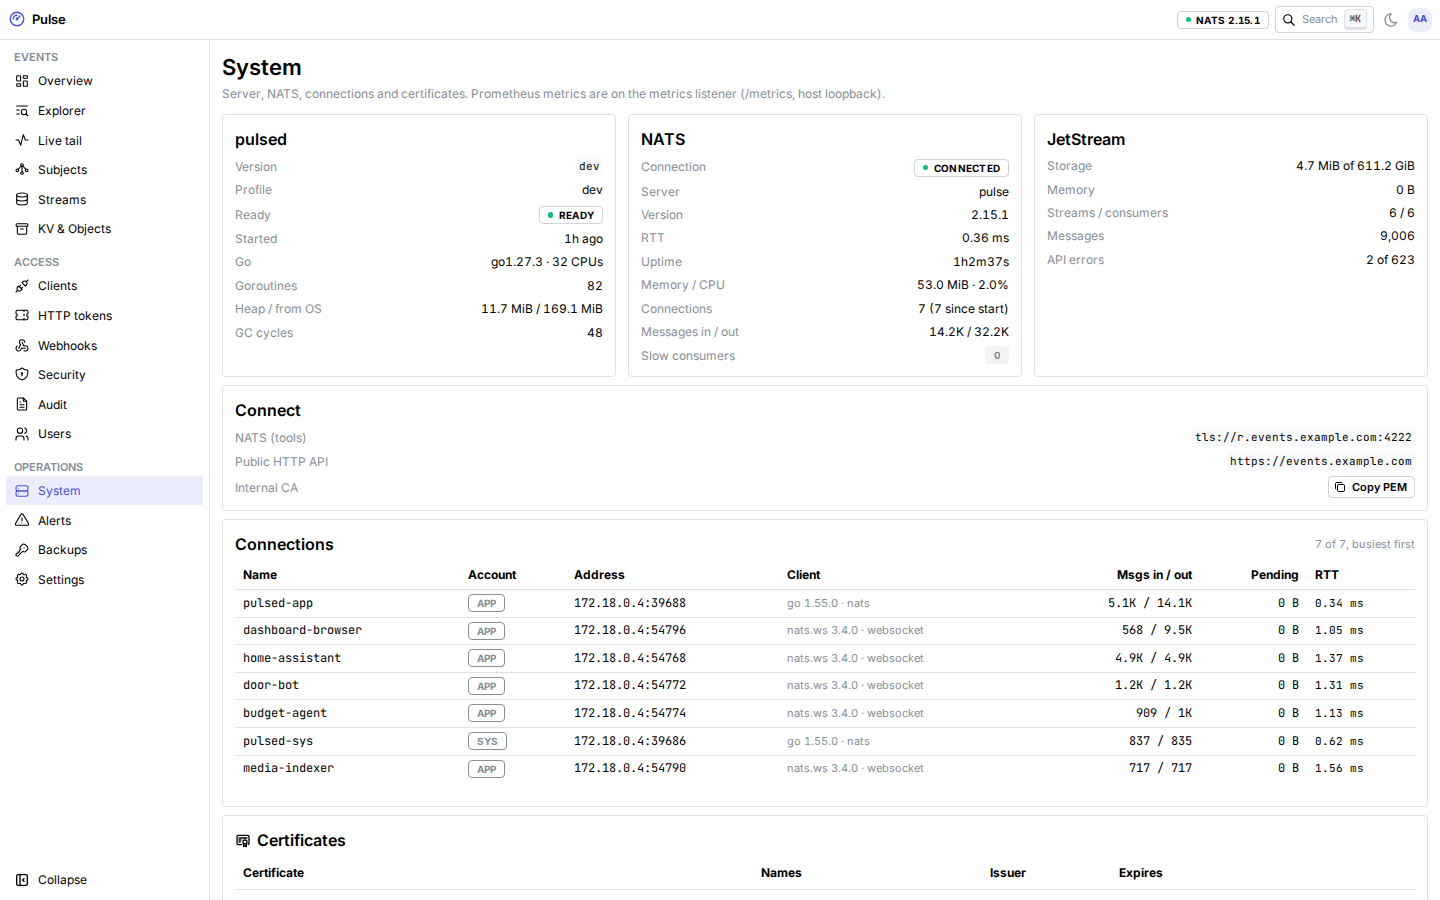
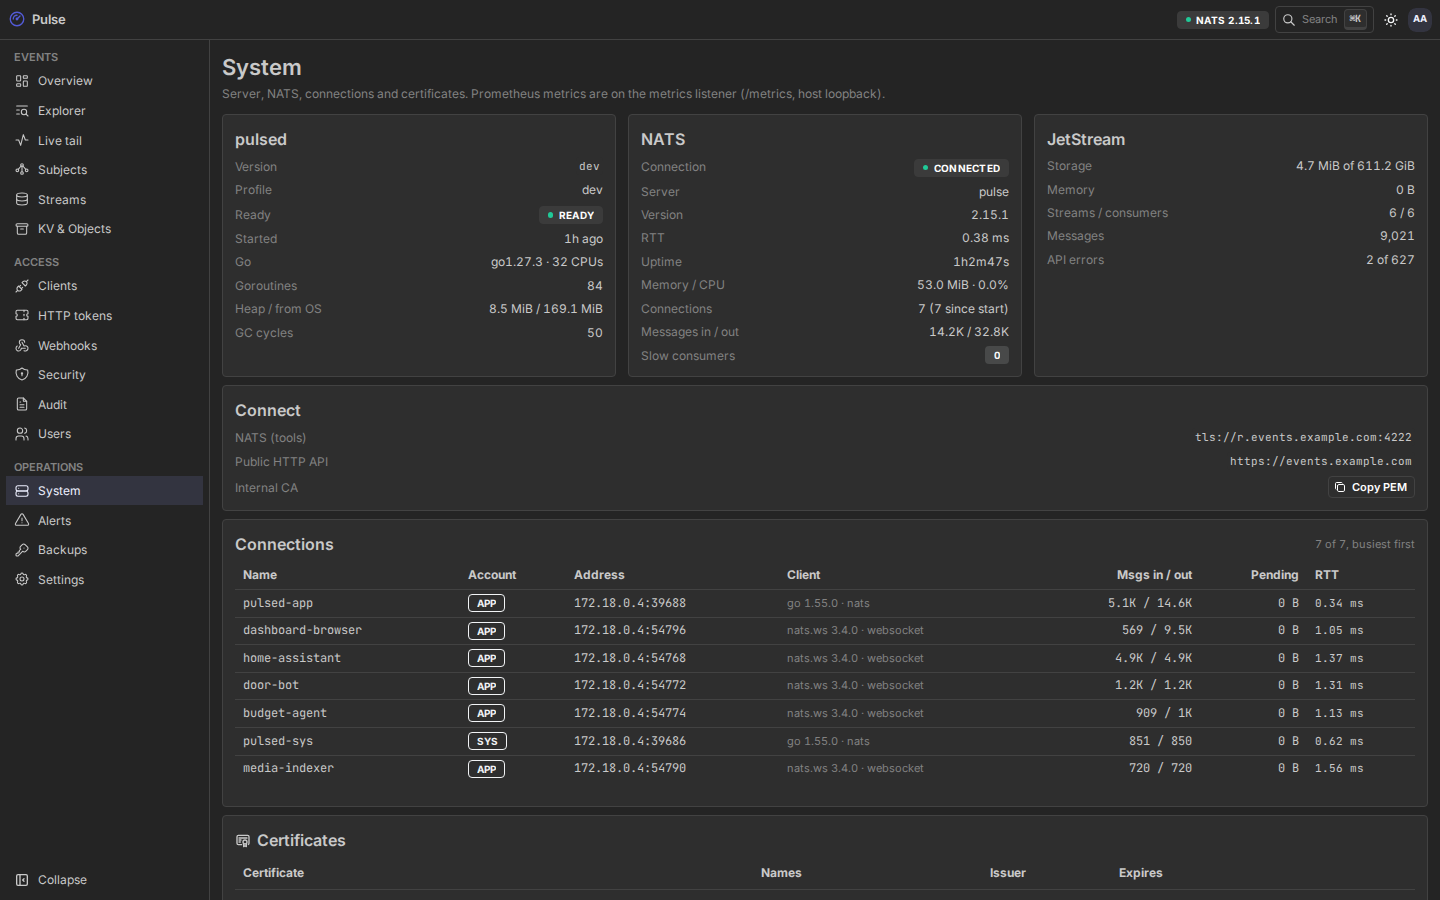
The System page shows pulsed's version, profile and runtime (memory, goroutines, uptime), the NATS server (version, connections, messages, slow consumers, memory, CPU), JetStream usage, the busiest connections across accounts, and every certificate with its expiry.
Alerts
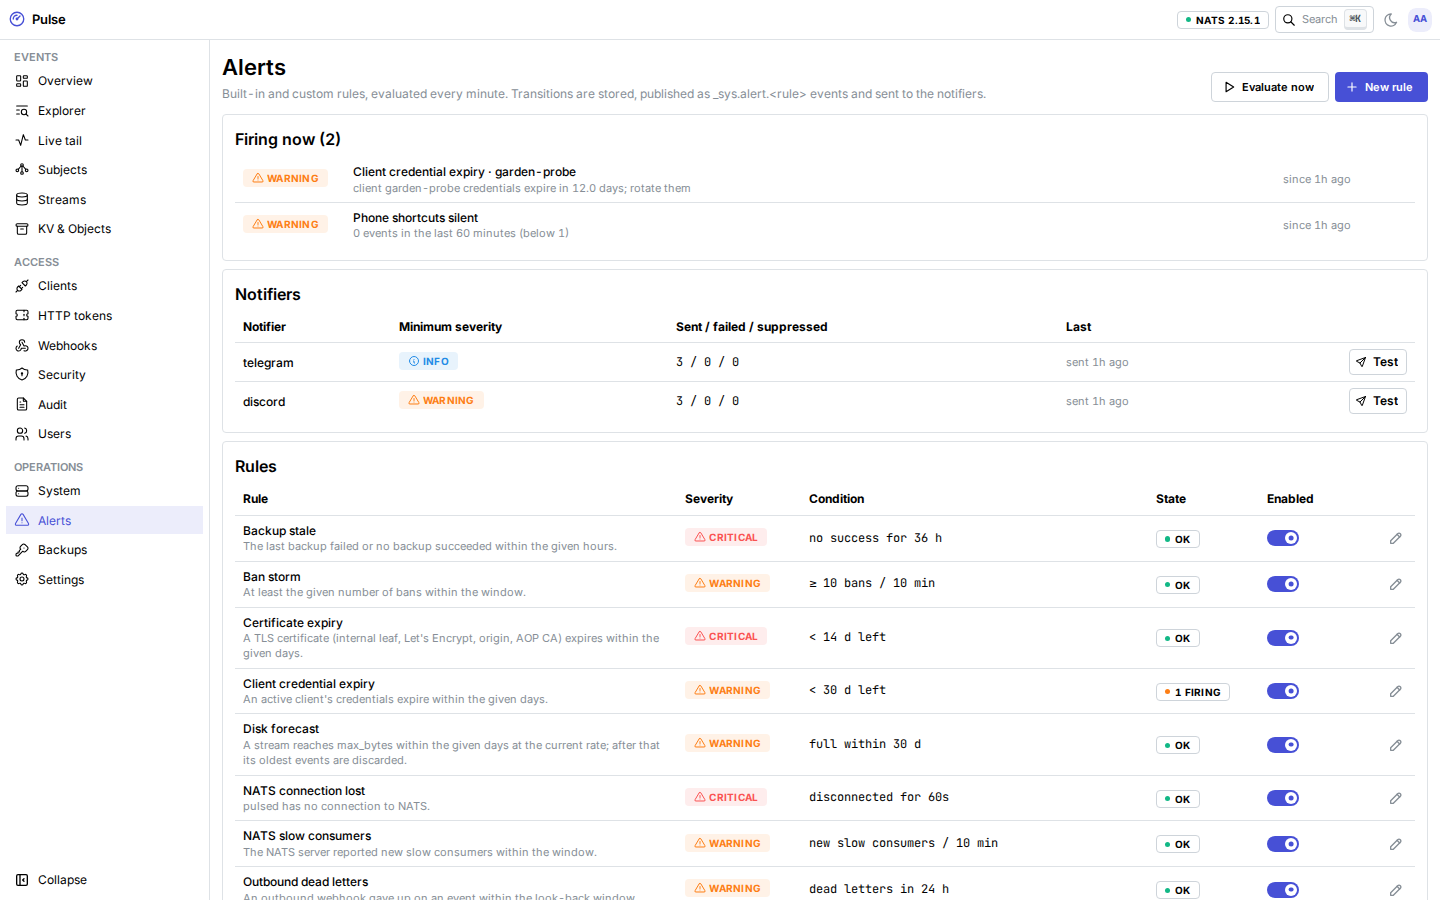
pulsed evaluates alert rules every PULSE_ALERT_INTERVAL (default 1 minute). Rules, their state and the history live in SQLite. The Alerts page lists every rule with its live state, lets you edit thresholds, enable or disable rules, evaluate now, and shows the firing and resolved history.
Built-in rules
| Rule | Fires when | Default | Severity |
|---|---|---|---|
disk_forecast | A stream reaches max_bytes within the given days at the current rate | 30 days | warning |
stream_usage | A stream uses more than the given fraction of max_bytes, or JetStream of its storage limit | 85% | warning |
cert_expiry | A certificate (internal leaf, Let's Encrypt, origin, AOP CA) expires within the given days | 14 days | critical |
backup_stale | The last backup failed, or none succeeded within the given hours | 36 h | critical |
client_expiry | An active client's credentials expire within the given days | 30 days | warning |
ban_storm | At least the given number of bans within the window | 10 in 10 min | warning |
slow_consumers | NATS reported new slow consumers within the window | 10 min | warning |
dead_letters | An outbound webhook gave up on an event within the look-back window | 24 h | warning |
nats_down | pulsed has no connection to NATS, for 60 seconds | — | critical |
backup_stale reports no data until backups are configured and have run. With EVENTS set to discard old, stream_usage keeps firing once history fills the stream; disable it for EVENTS if that is the steady state you want.
Custom threshold rules
A custom rule counts events or payload bytes from the rollups, for the whole stream, one ce-type, or one subject prefix, over a window, and fires when the count is above or below a threshold. below 1 makes a dead-man switch: "alert me when the door sensor has not sent anything for 2 hours".
| Field | Meaning |
|---|---|
| Stream | Default EVENTS |
| What | total, a type (ce-type, or (untyped)), or a prefix such as evt.home.door (1 to 4 tokens) |
| Metric | msgs or bytes |
| Window | Must be a multiple of the rollup step: prefixes of 1–2 tokens are counted per minute, 3 tokens per hour, 4 per day |
| Above / below, threshold | The condition |
| Severity, hold time | info, warning or critical; how long the condition must hold before it fires |
Only completed buckets count: a rule never fires on a minute, hour or day that is still being counted.
Alert events
Every transition is written to the history and published on NATS as an event a tool can react to:
subject:   _sys.alert.<rule id>        e.g. _sys.alert.cert_expiry
ce-type:   pulse.alert.firing.v1 | pulse.alert.resolved.v1
ce-source: pulsed
data:      {"rule_id","rule_name","kind","key","state","severity","summary","value","since","at"}
These are core NATS messages, not stored in a stream. A client needs a subscribe grant on _sys.alert.> (the only grantable _sys subject) to receive them.
Notifications
Alerts at or above a notifier's minimum severity (default warning) are sent to Telegram and/or Discord. While an alert keeps firing, a reminder goes out every PULSE_ALERT_REPEAT (default 24 h; off disables reminders). The Alerts page shows each notifier's sent, failed and suppressed counts and its last error, and has a Test button.
Telegram
Create a bot with @BotFather and copy its token.
Send the bot a message from the account or group that should receive alerts, then read the chat ID from
https://api.telegram.org/bot<token>/getUpdates.Configure:
shPULSE_TELEGRAM_BOT_TOKEN_FILE=/run/secrets/telegram_bot_token PULSE_TELEGRAM_CHAT_ID=123456789 PULSE_TELEGRAM_MIN_SEVERITY=warning # info | warning | critical
Discord
In the channel settings, Integrations → Webhooks → New Webhook, and copy its URL.
Put the URL in a secret file (it is a credential) and configure:
shPULSE_DISCORD_WEBHOOK_URL_FILE=/run/secrets/discord_webhook_url PULSE_DISCORD_MIN_SEVERITY=warning
Messages never mention anyone (@everyone and role mentions are disabled).
Notifiers send at most 20 (Telegram) or 25 (Discord) messages per minute, with a small burst. Messages over the limit are counted as suppressed, and the next delivered message says how many were dropped.